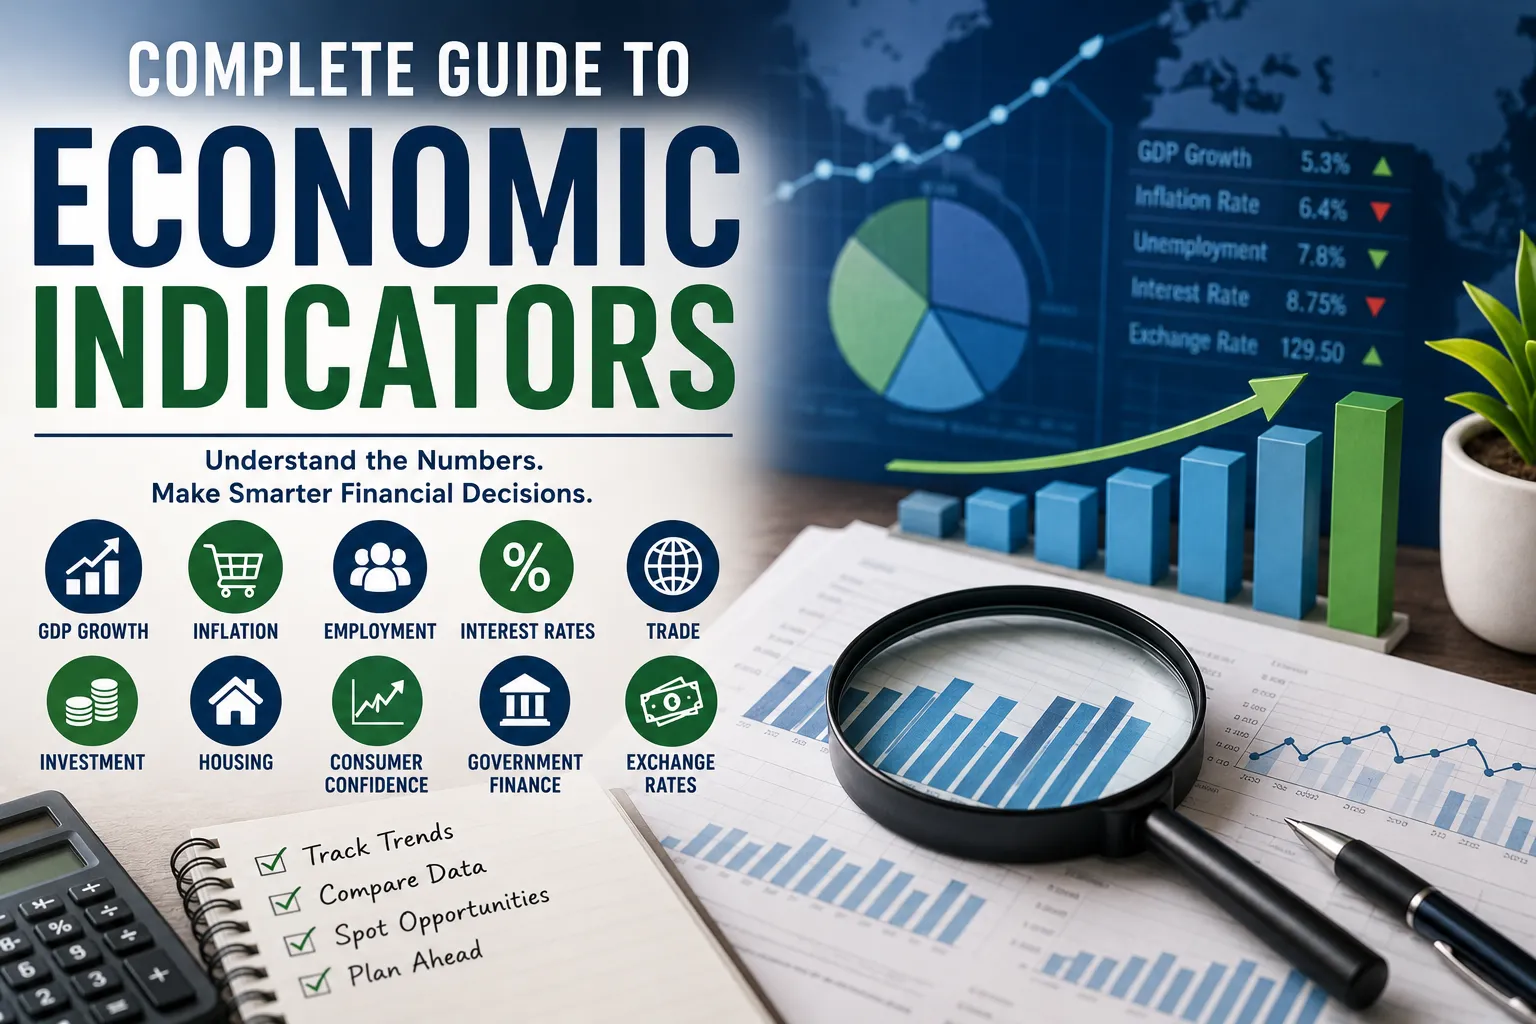
Complete Guide to Economic Indicators
Economic news is filled with numbers.
GDP is rising. Inflation is falling. Interest rates are changing. Unemployment is moving. The currency is strengthening or weakening. Consumer confidence is improving. Stock markets are rallying.
For many people, these headlines can feel disconnected from everyday life.
But economic indicators are essentially signals about what is happening in an economy and where it may be heading. They can help households understand changes in the cost of living, businesses assess demand, investors evaluate opportunities and risks, and policymakers decide whether the economy needs more or less support.
Understanding these indicators doesn’t require an economics degree.
You simply need to know what each number measures, why it matters, what its limitations are, and how different indicators fit together.
For Kenyan readers, the Kenya National Bureau of Statistics (KNBS) publishes many of the country’s most important economic statistics, including GDP, inflation, producer prices, balance of payments, and leading economic indicators. The Central Bank of Kenya (CBK) provides monetary-policy, interest-rate, financial-market, and other economic information.
What Are Economic Indicators?
Economic indicators are statistical measures that provide information about the condition or direction of an economy.
They can describe:
- Economic growth
- Prices
- Employment
- Consumer activity
- Business activity
- Manufacturing
- Trade
- Interest rates
- Currency movements
- Investment
- Housing
- Government finances
Some indicators describe what has already happened.
Others provide clues about what might happen next.
This distinction is important because an economic indicator isn’t a crystal ball. It is a piece of evidence that needs to be interpreted alongside other information.
Why Economic Indicators Matter
Economic indicators influence decisions at almost every level of the economy.
Households
Families can use economic information to understand changes in:
- Food prices
- Transport costs
- Interest rates
- Mortgage or loan payments
- Employment conditions
- Savings returns
- Purchasing power
For a closer look at how price changes affect household budgets, see how inflation affects everyday finances.
Businesses
Companies monitor indicators when deciding whether to:
- Hire employees
- Expand operations
- Increase production
- Adjust prices
- Borrow money
- Invest in equipment
- Enter new markets
Investors
Investors watch economic data for clues about:
- Corporate earnings
- Interest rates
- Inflation
- Currency movements
- Economic growth
- Market risk
Governments and Central Banks
Policymakers use economic indicators when making decisions about:
- Interest rates
- Government spending
- Tax policy
- Monetary policy
- Economic support programs
- Infrastructure investment
Understanding the numbers therefore helps explain many of the decisions appearing in financial and political news.
The Three Main Types of Economic Indicators
Economic indicators are often divided into three broad categories.
Leading Indicators
Leading indicators tend to change before the broader economy does.
They can provide clues about future economic activity.
Examples can include:
- Business confidence
- Consumer confidence
- New orders
- Building permits
- Stock-market activity
- Certain financial-market conditions
Leading indicators are useful because they can offer an early signal.
The downside is that they can be volatile and sometimes give misleading signals.
Coincident Indicators
Coincident indicators move broadly alongside current economic activity.
Examples include:
- Employment
- Industrial production
- Retail sales
- Personal income
They help describe what is happening in the economy now.
Lagging Indicators
Lagging indicators tend to respond after economic conditions have already changed.
Examples can include:
- Certain unemployment measures
- Corporate profits
- Some labor-cost measures
- Delinquency rates
Lagging indicators are still useful because they can confirm trends that were already developing.
Gross Domestic Product: The Economy’s Big Picture
Gross Domestic Product (GDP) is one of the most widely discussed economic indicators.
It measures the value of goods and services produced within an economy over a specified period.
GDP can be reported:
- Quarterly
- Annually
- In nominal terms
- In real terms
- On a per-capita basis
When the economy produces more goods and services, GDP generally grows.
When economic activity contracts significantly, GDP can decline.
For a more detailed look at how GDP connects with household finances, see what the latest GDP report actually means for your paycheck, spending and savings.
Real GDP vs. Nominal GDP
This distinction matters.
Nominal GDP reflects output using current prices.
Real GDP adjusts for price changes, making it more useful for assessing changes in actual economic output.
If GDP rises simply because prices increased, that doesn’t necessarily mean the economy produced substantially more goods and services.
Real GDP attempts to separate changes in production from changes in prices.
What Does GDP Growth Tell You?
GDP growth can provide a broad indication of economic momentum.
For example, KNBS reported that Kenya’s real GDP grew by 5.3% in the first quarter of 2026, compared with 4.9% in the corresponding quarter of 2025. Several sectors recorded growth, including accommodation and food services, manufacturing, construction, financial and insurance activities, information and communication, and agriculture.
That doesn’t mean every household or business experienced 5.3% growth.
GDP is an aggregate measure.
A growing economy can still contain households struggling with high living costs, businesses facing weak demand, or sectors experiencing contraction.
That’s why GDP should never be interpreted in isolation.
GDP Per Capita
GDP per capita divides economic output by population.
It can provide a rough indication of average economic output per person.
However, it is not the same thing as average household income.
A country’s GDP per capita can increase while income inequality remains high or while many households experience little improvement in their financial circumstances.
GDP per capita is therefore useful for broad comparisons, but it doesn’t tell the complete story of living standards.
Inflation: Measuring Changes in Prices
Inflation is one of the most important indicators for ordinary households.
It measures the rate at which the general price level is changing over time.
In Kenya, consumer inflation is measured using the Consumer Price Index (CPI).
KNBS reported annual consumer price inflation of 6.4% in June 2026, meaning the overall price level was 6.4% higher than in June 2025. Food and non-alcoholic beverages, transport, and housing-related costs were among the major contributors.
For a deeper explanation of a specific inflation reading, see 2.9% inflation rate.
Inflation Does Not Mean Every Price Rises by the Same Amount
If headline inflation is 6%, it doesn’t mean every product becomes exactly 6% more expensive.
Some prices can rise faster.
Others can rise more slowly.
Some can even fall.
The published inflation rate represents a weighted basket of goods and services.
Your personal experience can therefore differ from the national inflation rate depending on what you buy.
Consumer Price Index
The Consumer Price Index, or CPI, tracks changes in the prices of a representative basket of goods and services purchased by consumers.
It is commonly used to calculate consumer inflation.
CPI can include categories such as:
- Food
- Transport
- Housing
- Utilities
- Clothing
- Health
- Education
- Recreation
- Communication
- Restaurants and accommodation
The weights assigned to different categories matter because households don’t spend equal amounts on every category.
Headline Inflation vs. Core Inflation
Headline inflation includes the broader basket used by the relevant statistical authority.
Core inflation generally attempts to remove or reduce the influence of particularly volatile components to provide a clearer view of underlying price pressures.
The exact definition varies between countries and institutions.
Why does this matter?
Because temporary changes in fuel or food prices can cause headline inflation to move sharply even when underlying price pressures are behaving differently.
Policymakers therefore often examine several inflation measures rather than relying on one number.
For a practical look at what a cooling inflation environment can mean for households, see inflation is cooling but savers still need to protect their purchasing power.
Producer Price Index
Consumers aren’t the only ones affected by changing prices.
Businesses also face changing costs.
The Producer Price Index (PPI) measures changes in prices received by producers for their output.
It can provide clues about cost pressures within the production chain.
For example, if producer prices rise significantly, businesses may eventually face pressure to increase their selling prices.
But a higher PPI doesn’t automatically mean consumer inflation will rise by the same amount.
Businesses can absorb some costs, become more efficient, change suppliers, reduce margins, or adjust production.
KNBS reported that Kenya’s producer-price inflation was -1.81% year-on-year in the first quarter of 2026, illustrating that producer prices can move differently from consumer prices.
Unemployment and Employment Indicators
Employment data provides another important window into economic health.
A strong labor market can support:
- Household incomes
- Consumer spending
- Tax revenues
- Business activity
- Economic growth
A weak labor market can reduce household purchasing power and consumer demand.
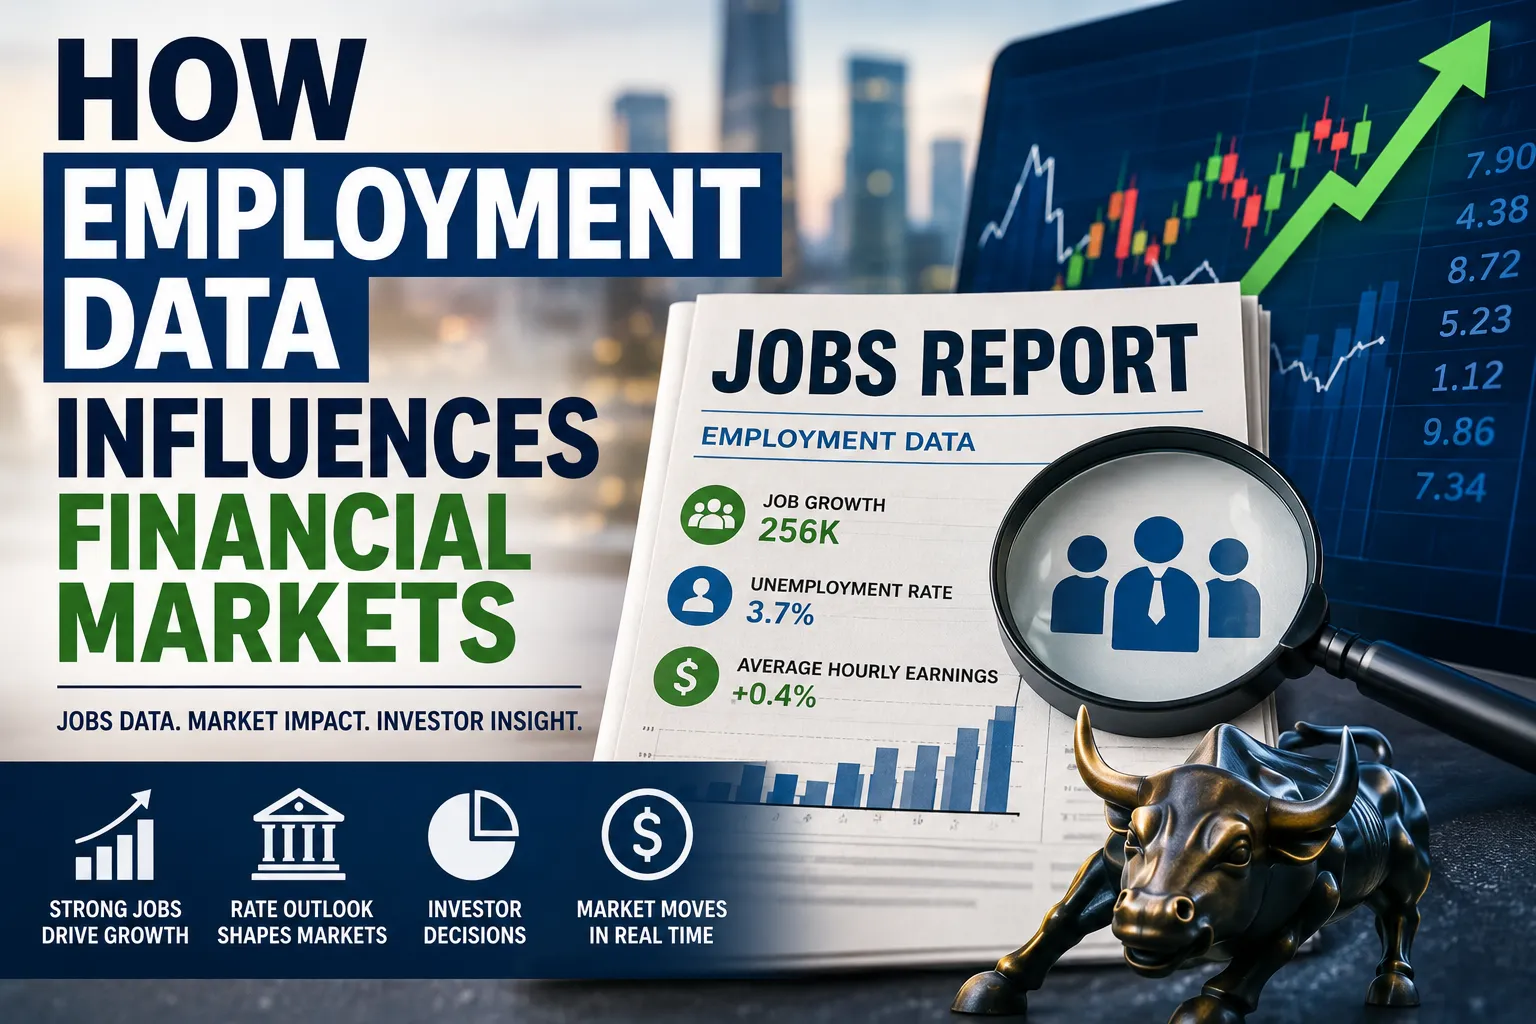
For a market-focused explanation of this relationship, see how employment data influences financial markets.
But unemployment statistics require careful interpretation.
A person who is not working may be:
- Actively looking for work
- Studying
- Retired
- Caring for family
- Temporarily unavailable
- Discouraged from searching
Different statistical systems define employment and unemployment differently.
Underemployment Matters Too
Someone can technically have a job and still struggle to earn enough income or obtain sufficient working hours.
This is why unemployment alone doesn’t capture the entire condition of a labor market.
Underemployment, informal employment, labor-force participation, working hours, and wage growth can provide additional context.
For countries with large informal sectors, these measures can be particularly important.
Wage Growth
Wages tell us whether workers’ incomes are changing.
Rising wages can support household spending and improve purchasing power.
But wage growth needs to be compared with inflation.
If wages increase by 5% while consumer prices rise by 7%, workers may experience a decline in real purchasing power.
The key figure is therefore often real wage growth, rather than nominal wage growth alone.
Interest Rates
Interest rates affect the cost of borrowing and the reward for saving.
When interest rates rise:
- Loans can become more expensive
- Mortgage payments may increase for some borrowers
- Businesses may reduce borrowing
- Savings products may offer higher returns
- Investment decisions can change
When rates fall, the opposite pressures can emerge.
Interest rates are therefore one of the most important links between economic policy and household finances.
For a dedicated explanation, see understanding interest rates and their effects.
The Central Bank Rate
Central banks use policy interest rates to influence financial conditions.
In Kenya, the Central Bank Rate (CBR) is an important monetary-policy tool.
The CBK’s February 2026 material reported that the CBR had been reduced from 9.00% in January to 8.75% in February, alongside declines in Treasury-bill yields during that period.
Changes in the policy rate don’t necessarily translate immediately or equally into every bank’s lending and deposit rates.
Banks consider funding costs, competition, credit risk, operating costs, and other factors.
Why Central Banks Care About Inflation
Central banks generally want to avoid both persistently high inflation and excessively weak economic activity.
If inflation is too high, a central bank may use tighter monetary policy to reduce demand and inflationary pressure.
If economic activity is weak and inflation pressures are contained, it may have more room to ease policy.
The challenge is that monetary policy works with delays.
A decision made today can influence borrowing, spending, investment, employment, and prices months later.
For a deeper explanation of this relationship, see how monetary policy affects financial markets.
Exchange Rates
An exchange rate tells you how much one currency is worth relative to another.
For Kenya, movements in the shilling against currencies such as the US dollar can affect:
- Imported goods
- Fuel costs
- Machinery
- Electronics
- Travel
- Foreign debt
- Export competitiveness
- Imported raw materials
A weaker currency can make imports more expensive, although the ultimate effect depends on global prices, contracts, hedging, and how businesses respond.
A stronger currency can make imports cheaper but may create challenges for some exporters.
Trade Balance
The trade balance compares the value of a country’s exports with its imports.
If exports exceed imports, the country has a trade surplus.
If imports exceed exports, it has a trade deficit.
A trade deficit isn’t automatically a sign of economic weakness.
A country may import machinery and equipment today that supports future production and exports.
Similarly, a trade surplus isn’t automatically proof that an economy is healthy.
The composition of trade matters.
Current Account Balance
The current account provides a broader picture of a country’s transactions with the rest of the world.
It can include:
- Trade in goods
- Trade in services
- Primary income
- Transfers such as remittances
This makes it broader than the trade balance alone.
A country can have a merchandise trade deficit while receiving significant service income or remittances that reduce its overall current-account deficit.
Balance of Payments
The balance of payments (BOP) records economic transactions between residents of a country and the rest of the world over a specified period.
It includes current-account transactions and financial flows.
For investors and policymakers, the BOP can provide insight into external financing needs and the country’s relationship with global capital.
KNBS includes quarterly balance-of-payments statistics among its major economic releases.
Consumer Confidence
Economic statistics don’t only come from government agencies.
Surveys can measure how households and businesses feel about economic conditions.
Consumer confidence can provide clues about whether households expect:
- Higher income
- Better employment conditions
- Higher prices
- Improved economic activity
- Greater financial security
Confidence can influence spending.
If consumers feel optimistic, they may be more willing to make large purchases.
If they feel uncertain, they may postpone spending and increase precautionary savings.
For a closer look at this relationship, see consumer confidence falls and what it could mean for household spending and saving.
A separate look at the potential impact of a consumer-confidence release is available in consumer confidence reports and household budgets.
However, confidence surveys measure sentiment, not actual economic output.
Business Confidence
Business surveys can reveal how companies view:
- Demand
- Employment
- Investment
- Production
- Costs
- Future sales
Business confidence can sometimes change before official economic data is released.
That makes it potentially useful as a leading indicator.
But sentiment can also be affected by political events, global uncertainty, weather, expectations, or temporary news.
Retail Sales
Retail sales measure consumer spending through various retail channels.
Because household consumption is an important part of many economies, retail sales can provide a useful snapshot of consumer demand.
Strong retail sales may suggest households are spending actively.
Weak sales may signal caution.
For a market-focused example, see how retail sales can move stocks.
For a household-focused perspective, see what falling U.S. retail sales can mean for household budgets.
However, higher sales values don’t necessarily mean consumers are buying more physical goods.
Inflation can push the value of sales higher even when the quantity of goods purchased is not increasing.
Industrial Production
Industrial production tracks activity in sectors such as manufacturing, mining, and utilities, depending on the statistical system.
It can provide insight into the health of productive sectors.
An increase in industrial output can indicate stronger demand or investment.
A sustained decline may signal weaker economic activity.
For economies with significant manufacturing or mining sectors, industrial production can be especially informative.
Purchasing Managers’ Index
The Purchasing Managers’ Index (PMI) is a widely followed business survey indicator.
It typically gathers information from purchasing managers about areas such as:
- New orders
- Production
- Employment
- Supplier deliveries
- Inventories
A reading above the commonly used 50 threshold generally indicates expansion in the surveyed activity, while a reading below 50 indicates contraction.
PMIs are popular because they are often released relatively quickly.
However, they are survey-based indicators rather than direct measurements of GDP.
Housing Indicators
The property market can provide clues about economic conditions.
Useful housing indicators can include:
- House prices
- Building permits
- Construction activity
- Mortgage lending
- Property transactions
- Rents
- Construction costs
A strong property market can support construction, employment, materials demand, and financial activity.
But rapidly rising property prices can also create affordability concerns.
Government Debt and Fiscal Indicators
Governments borrow money to finance spending and investment.
Important fiscal indicators include:
- Budget deficit
- Public debt
- Debt-to-GDP ratio
- Government revenue
- Government expenditure
- Interest payments
- Tax collections
These numbers matter because government borrowing can influence interest rates, investor confidence, public investment, and future taxation.
A high debt burden doesn’t automatically mean a country is in crisis.
The important questions include:
- How large is the debt?
- Who holds it?
- What are the interest costs?
- When does it mature?
- What currency is it denominated in?
- How quickly is the economy growing?
- Can government revenues support repayment?
For a more detailed explanation of how government spending and taxation influence economic activity, see fiscal policy: government spending and taxes explained.
Debt-to-GDP Ratio
The debt-to-GDP ratio compares public debt with the size of the economy.
It is often used as a broad measure of debt sustainability.
However, it shouldn’t be interpreted as a simple pass-or-fail threshold.
Two countries with the same debt-to-GDP ratio can face very different circumstances depending on interest rates, growth, currency exposure, maturity profiles, revenue capacity, and investor confidence.
Government Revenue
Tax collections and other government revenues show how much money the state is collecting.
Revenue matters because governments need resources to fund:
- Public services
- Infrastructure
- Healthcare
- Education
- Security
- Debt servicing
- Social programs
If revenue consistently falls short of expenditure, borrowing or spending reductions may become necessary.
Corporate Profits
For investors, corporate earnings can sometimes be more immediately relevant than broad economic growth.
A growing economy doesn’t guarantee that every company will be profitable.
A business can struggle because of:
- Rising costs
- Weak demand
- Competition
- High debt
- Poor management
- Currency movements
- Regulatory changes
Corporate earnings therefore provide a bridge between macroeconomic conditions and individual investments.
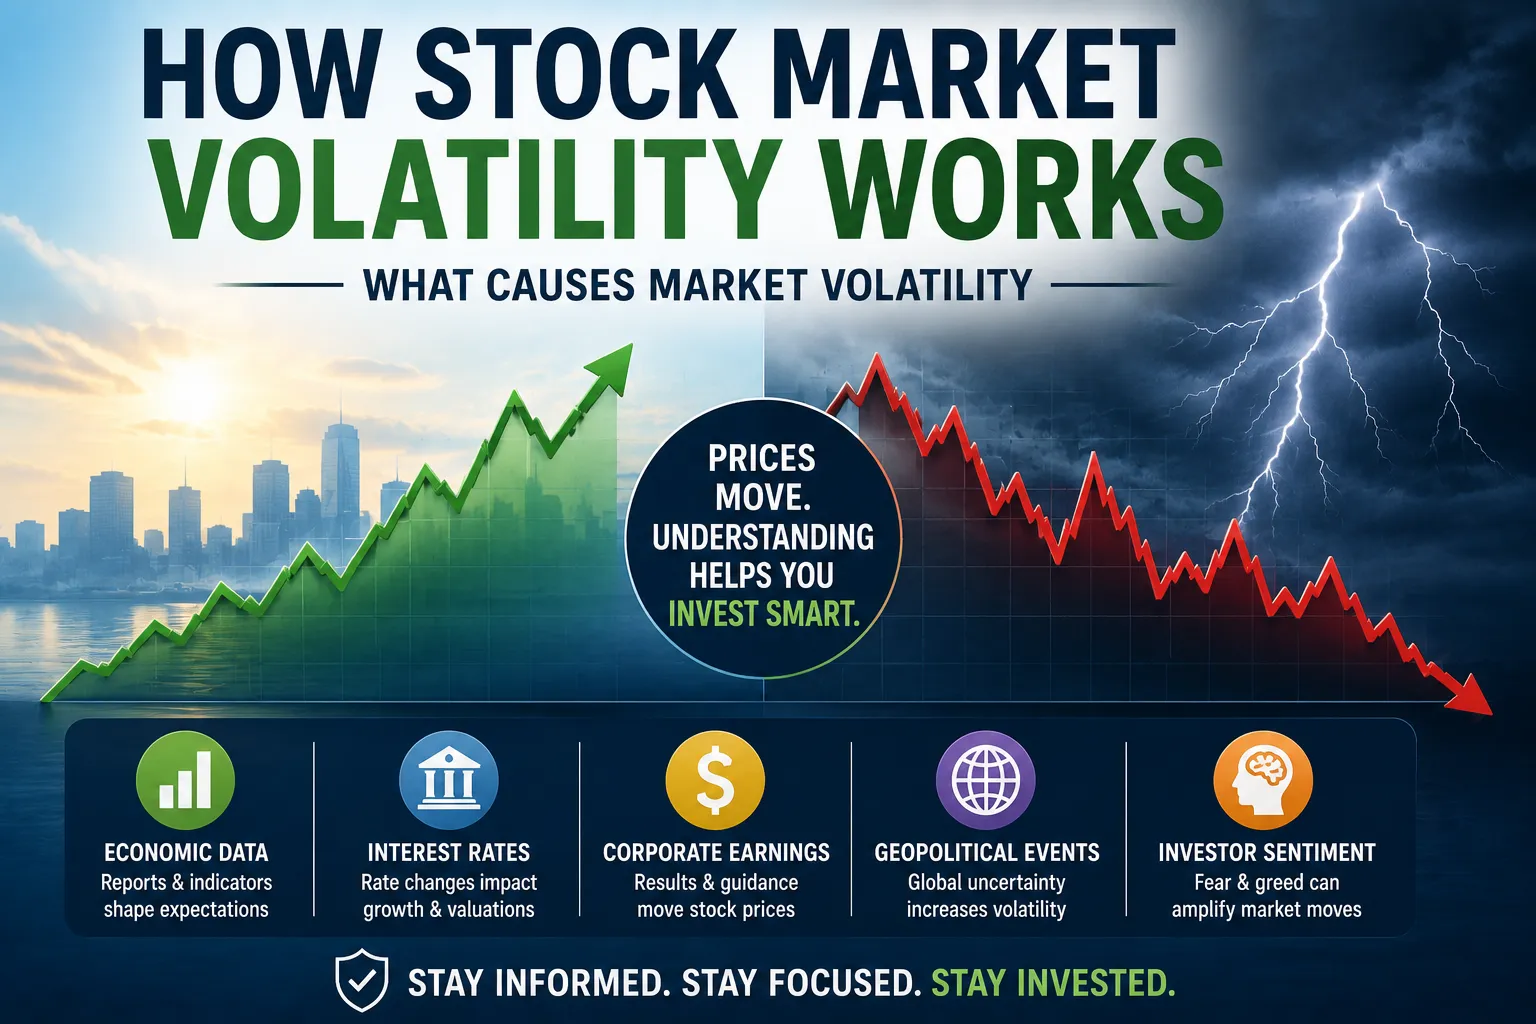
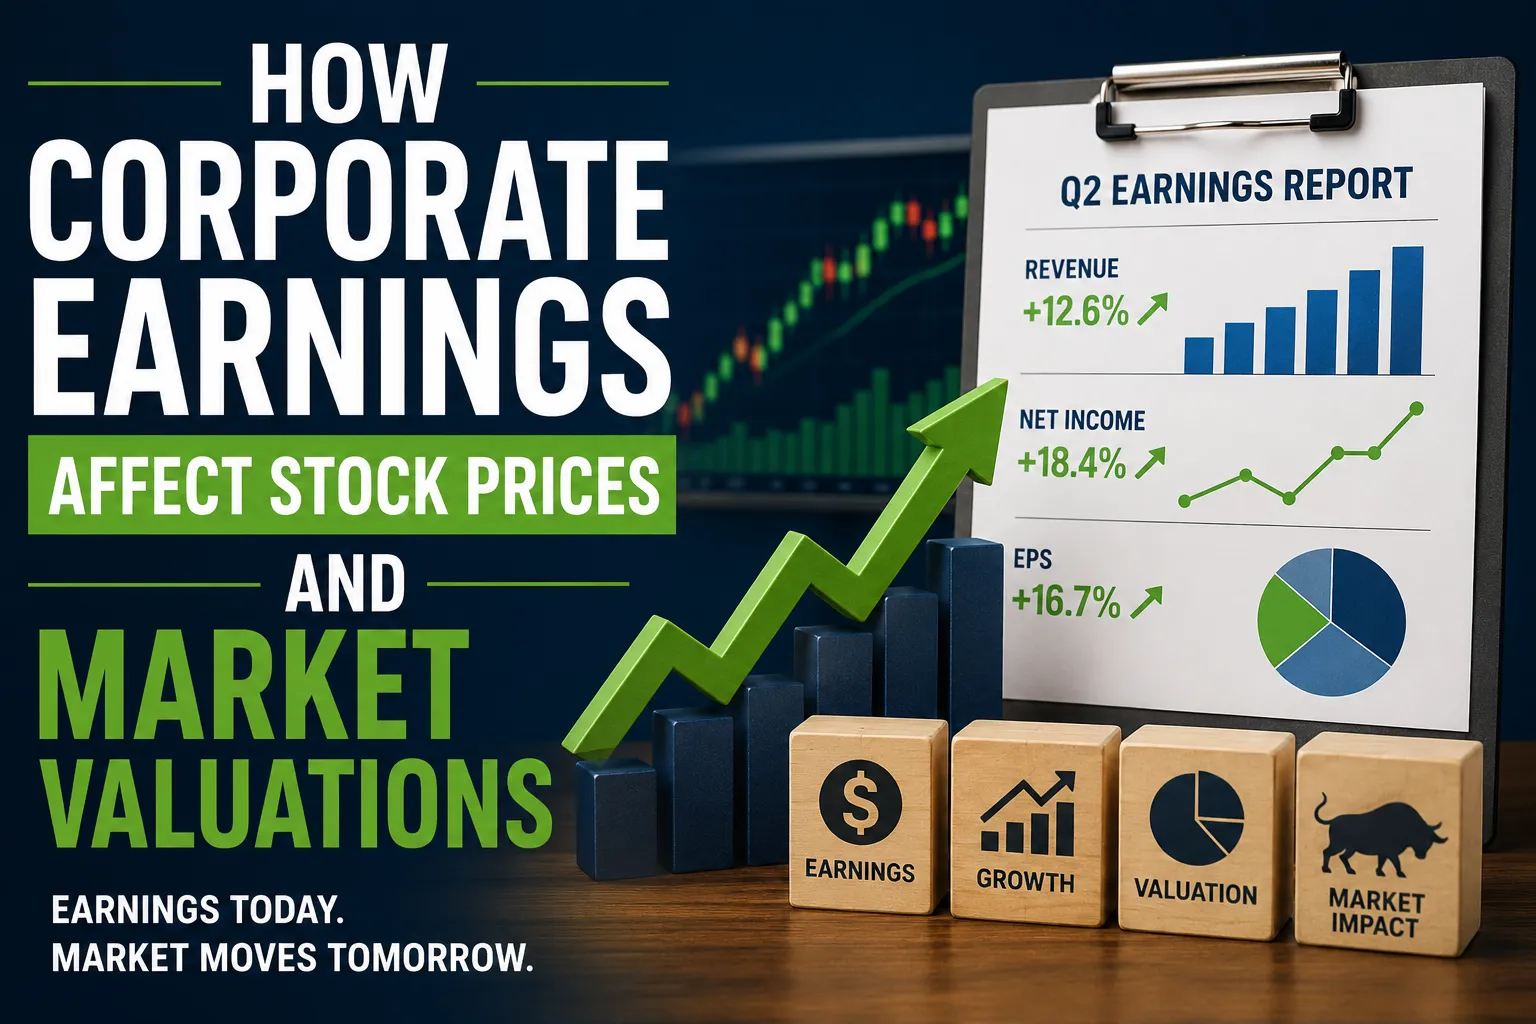
For more on this relationship, see how corporate earnings affect stock prices and market valuations.
Stock Market Indicators
Stock indexes can provide information about investor expectations.
Markets often react not only to current economic conditions but also to expectations about the future.
That means stock prices can rise while current economic data looks weak if investors expect conditions to improve.
Likewise, markets can fall during a period of strong current growth if investors believe future growth will slow.
This is why markets are sometimes described as forward-looking.
Leading Indicators and the Stock Market
Stock prices can sometimes function as a leading economic signal, but they are not a perfect predictor.
Markets are influenced by:
- Corporate earnings
- Interest rates
- Global events
- Investor sentiment
- Currency movements
- Political developments
- Risk appetite
- Valuations
A stock-market rally therefore doesn’t automatically mean an economic boom is coming.
Money Supply and Credit Growth
Economists also monitor the amount of money circulating through an economy and the pace at which credit is expanding.
Credit growth can provide clues about:
- Business investment
- Household borrowing
- Consumer spending
- Financial conditions
Rapid credit expansion can support economic growth but may also create financial risks if borrowing becomes excessive.
Weak credit growth can signal cautious banks and borrowers or tighter financial conditions.
Productivity
Productivity measures how efficiently an economy produces goods and services using inputs such as labor and capital.
Higher productivity can support:
- Higher wages
- Greater output
- Business competitiveness
- Economic growth
- Improved living standards
Long-term economic growth isn’t simply about having more workers or machines.
It’s also about producing more value from available resources.
For a deeper discussion of productivity and living standards, see what drives economic growth and how productivity affects living standards.
Commodity Prices
Commodity prices can have a major influence on economies that import or export raw materials.
Important commodities can include:
- Oil
- Natural gas
- Gold
- Coffee
- Tea
- Agricultural products
- Metals
For an oil-importing economy, a sharp rise in crude prices can increase transport and production costs.
For an oil-exporting economy, the same price increase can boost export revenues.
The effect depends on the country’s economic structure.
Why Oil Prices Matter to Kenya
Oil is particularly important because fuel costs affect much more than the price displayed at a petrol station.
Higher fuel prices can increase the cost of:
- Transportation
- Food distribution
- Manufacturing
- Construction
- Logistics
- Electricity generation in some circumstances
This can create broader inflationary pressure.
That is one reason global commodity markets can eventually affect household budgets thousands of kilometers away from where the commodity was produced.
Economic Indicators Don’t Always Agree
This is one of the most important lessons for anyone following financial news.
You can have:
- Strong GDP growth
- High inflation
- Weak consumer confidence
- Rising employment
- Falling household purchasing power
All at the same time.
There is no contradiction.
Different indicators measure different aspects of the economy.
The economy isn’t one number.
It is a collection of interconnected systems.
How to Read an Economic Indicator Properly
When a new economic figure is released, don’t immediately ask whether the number is “good” or “bad.”
Start with five questions.
1. What Does It Measure?
Understand exactly what the statistic represents.
2. What Period Does It Cover?
A monthly figure is different from a quarterly or annual figure.
3. What Was Expected?
Financial markets often react to the difference between the reported number and expectations.
4. How Does It Compare With the Previous Period?
Look for the direction of change.
5. What Other Indicators Say
Check whether employment, inflation, production, spending, and other measures tell a consistent story.
Year-on-Year vs. Month-on-Month
Economic statistics often use different comparison periods.
Year-on-Year
Compares a period with the same period a year earlier.
This can reduce the influence of seasonal patterns.
Month-on-Month
Compares one month with the immediately preceding month.
It can show recent momentum but may be more affected by seasonal changes.
Quarter-on-Quarter
Compares one quarter with the previous quarter.
Again, seasonal adjustment and methodology matter.
Never compare numbers without first checking the measurement period.
Economic Growth vs. Economic Well-Being
A growing economy doesn’t necessarily mean every person is becoming financially better off.
GDP doesn’t directly measure:
- Household wealth
- Income distribution
- Quality of public services
- Environmental damage
- Unpaid household work
- Personal financial stress
That is why economists and policymakers use many indicators rather than relying solely on GDP.
How Indicators Affect Everyday Life
Economic indicators may sound abstract, but their effects can eventually reach ordinary households.
Inflation
Can affect grocery and transport bills.
Interest Rates
Can affect loan payments and savings returns.
Exchange Rates
Can affect imported goods and travel.
Employment
Can affect household income.
GDP Growth
Can influence business activity and job opportunities.
Government Debt
Can affect fiscal policy and future spending decisions.
Consumer Confidence
Can influence how willing households are to spend.
The numbers become meaningful when you connect them to real economic behavior.
A Practical Economic Dashboard for Households
You don’t need to monitor dozens of statistics every morning.
A simple dashboard could include:
| Indicator | What It Tells You |
|---|---|
| Inflation | How quickly consumer prices are changing |
| Interest rates | Direction of borrowing and saving conditions |
| GDP growth | Broad economic activity |
| Employment | Labor-market health |
| Exchange rate | Currency strength and import pressures |
| Fuel prices | Transport and production cost pressures |
| Food prices | Household cost-of-living pressure |
| Government debt | Public-finance position |
| Consumer confidence | Household expectations |
| Business confidence | Corporate expectations |
Following these indicators over time can provide a much clearer picture than reacting to individual headlines.
Where to Find Reliable Economic Data
Economic information is easiest to interpret when it comes from the organizations responsible for producing or publishing the underlying statistics.
For Kenya, useful sources include:
- Kenya National Bureau of Statistics
- Central Bank of Kenya
- Government budget and fiscal publications
- Official statistical releases
- Recognized international economic institutions
KNBS publishes dedicated statistical-release categories covering leading economic indicators, CPI and inflation, producer prices, GDP, balance of payments, and other measures.
When reading financial news, check whether a story is reporting an official figure, an estimate, a forecast, or an analyst’s interpretation.
Those are not the same thing.
The Difference Between Data and Forecasts
An economic statistic describes what has been measured.
A forecast describes what someone expects to happen.
For example:
“GDP grew 5.3%.”
is a measurement of reported economic activity.
“GDP is expected to grow 5.5% next year.”
is a forecast.
Forecasts can be useful, but they can also change as new information arrives.
Never treat a forecast as a guaranteed outcome.
Revisions Matter
Economic data isn’t always final when it is first published.
Statistical agencies may revise previous estimates as more complete information becomes available.
This means you might see a news headline saying:
“GDP growth revised upward.”
That doesn’t necessarily mean the economy suddenly changed.
It can mean the measurement of an earlier period became more accurate.
Economic Indicators Should Be Read as a Story
The biggest mistake is treating each economic number as an isolated fact.
Instead, think of the economy as a story.
Suppose:
- Inflation is falling.
- Interest rates are easing.
- Credit growth is improving.
- Consumer confidence is recovering.
- Business activity is strengthening.
Together, those indicators may suggest improving economic conditions.
But suppose inflation is falling because consumer demand has weakened sharply while unemployment is rising.
The interpretation becomes very different.
The relationship between indicators is often more informative than any single number.
For an example of how multiple indicators can interact during a downturn, see how recessions happen and affect financial markets.
The broader relationship between economic expansions, slowdowns and markets is also explored in how economic and financial market cycles work.
Build the Habit of Looking Beyond the Headline
Economic indicators can seem intimidating because financial news often presents them as a stream of percentages, indexes, rates, and forecasts.
But once you understand what the numbers represent, the picture becomes much easier to follow.
Start with the basics:
GDP tells you about economic output.
Inflation tells you about changes in prices.
Employment tells you about the labor market.
Interest rates tell you about monetary conditions.
Exchange rates tell you about currency values.
Trade and balance-of-payments data tell you about a country’s external economic relationships.
Confidence surveys tell you how households and businesses perceive the future.
Government fiscal data tells you about public finances.
No single indicator can explain an economy.
The real skill is learning how to put the numbers together, understand what they can—and cannot—tell you, and connect them to the decisions being made by households, businesses, investors, governments, and central banks.
Once you do that, economic news stops looking like a collection of mysterious percentages and starts becoming something much more useful: a running picture of how the economy is performing, where pressure is building, and what may come next.